Sample design weights are required for all countries whose sampling design used different strata or divisions. If the sample has been collected using different procedures, or if the sample has been conducted independently using the same sampling procedure, for different portions of the sample, then weights should be calculated separately for each strata. The most typical sampling approach using strata does so by dividing the country being sampled into geographic areas. The determination of which variables and strata are used in calculating sample design weights follows from the specific sample design for the country being examined. Thus, for example, a sample design based on six regions in a country would have weights calculated separated for each of these six regions.
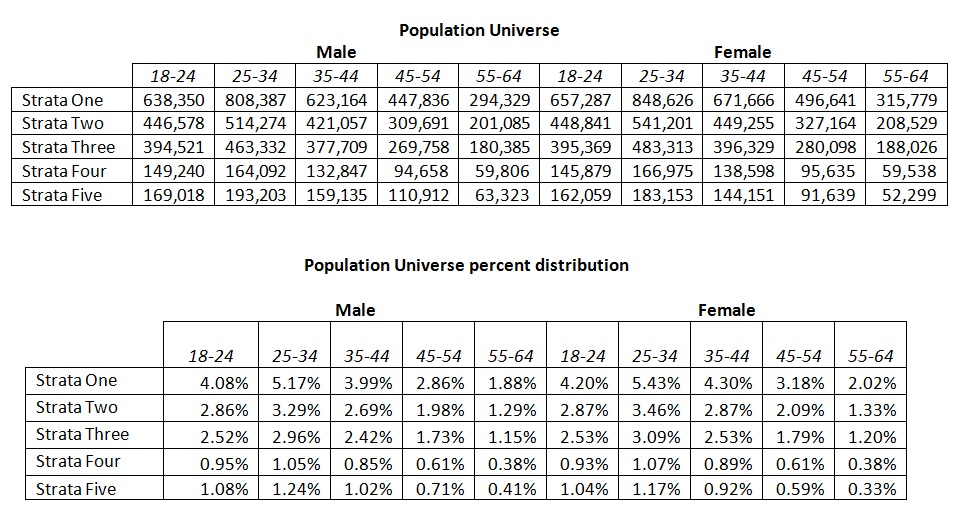
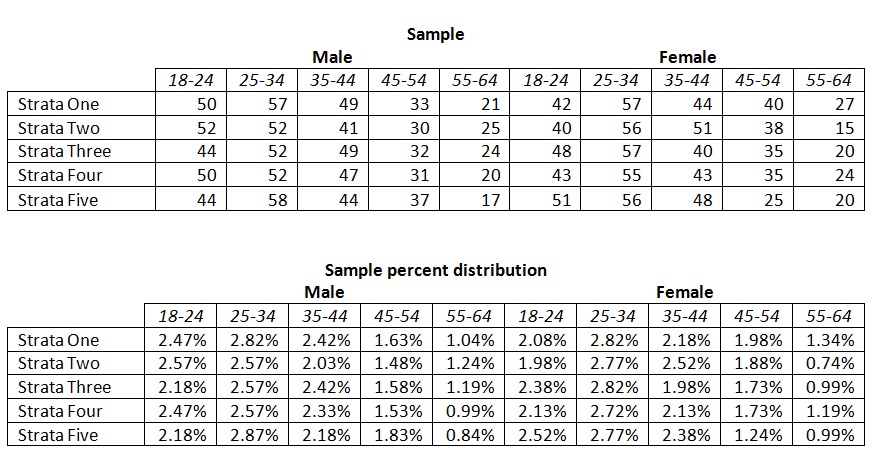
The sample design weights are computed as follows. When there is more than one stratum for which sample design weights must be calculated, the data for the universe and the data for the sample are tallied for each stratum, and a process similar to that used for calculating response weights is used. The APS sample data is tabulated into a three-way table by stratum, gender and age group, with each cell representing the proportion of the total sample represented by that stratum-age-gender combination (e.g., one cell would have the proportion of the sample in stratum one that are female aged 45 to 54). The reference population is tabulated into a three-way table using the exact same cell definitions.
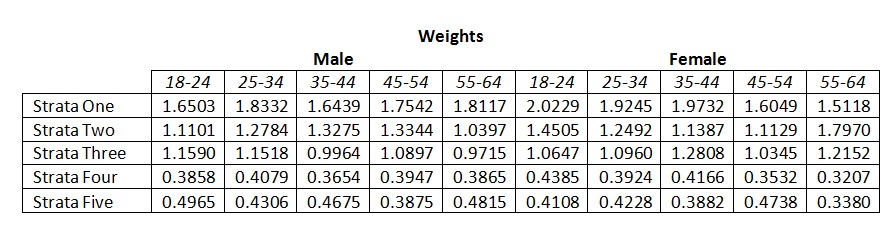
A third table is then calculated, using the same three-way table structure of age by gender by stratum, where each cell is the ratio of the sample proportion to the reference population proportion for that stratum -age-gender combination. This process is repeated for every cell in the table. Once all the raw weights have been computed, they are summed to determine their total of all the weights across all the respondents, which is then divided by the number of cases in the sample, to scale all the response weights to have an average weight of 1.0. An example calculation is presented below:
Distribution of Population:
Distribution of sample by Strata, age, and gender:
- Calculate weight for each combination of age group - gender - strata
- Weight = Expected percentage / observed percentage.
- Weight = Percent distribution in population / percent distribution in sample.
For practically every main GEM measure on prevalence rates of entrepreneurial attitudes, activity and aspirations, such as those published in the annual GEM Global reports, WEIGHT_L is used. For some measures, like the informal investors rate, it makes sense to include individuals aged 65 and older and to use WEIGHT_A accordingly. However, care needs to be taken as not every country has individuals aged 65+ included in the sample. Weights included in the database apply to the country and the year of the survey. This means that care needs to be taken when analyzing data on a group of countries and over multiple years.
To use weights in your analysis, the following SPSS syntax may serve as an example.
USE ALL.
* Example: analysis for Germany (country code 49) and year 2007.
COMPUTE FILDE07=0.
IF ((YRSURV=2007) & (COUNTRY=49)) FILDE07=1.
FILTER BY FILDE07.
* Rate of nascent entrepreneurship, TEA and established business ownership rate.
WEIGHT BY WEIGHT_L.
DESCRIPTIVES SUBOANW TEAYY ESTBBUSO.
* Rate of informal investors: 18+.
* Please note that not all countries’ samples include individuals aged 65+.
WEIGHT BY WEIGHT_A.
DESCRIPTIVES BUSANGYY.